


EFFECTS ON THE SUSPENSION
“Temperature affects the oil, the gas pressure, and the seals in the shock. It can also increase and/or decrease certain tolerance fits inside the damper itself. Aluminum shocks may be affected differently than steel, as well as aluminum pistons compared to steel pistons. During the course of your race, the damper changes. Do you know what is happening to it from the beginning to the end? Is it important?”
EFFECTS ON THE SUSPENSION
ROEHRIG ENGINEERING TEST REPORT
“Temperature affects the oil, the gas pressure, and the seals in the shock. It can also increase and/or decrease certain tolerance fits inside the damper itself. Aluminum shocks may be affected differently than steel, as well as aluminum pistons compared to steel pistons. During the course of your race, the damper changes. Do you know what is happening to it from the beginning to the end? Is it important?”
SPECIFICATIONS
Handle
Dimension: 109x83x64 mm
Weight: 90g
Material: Fibreglass,
Reinforced plastic,
Thermoplastic polyurethane
Power Supply
Dimension: 235x77x50 mm
Weight: 700 g
Material: Aluminium + Rubber
Power: 100-240 Volt
Cords
Dimension: Ø6, 1500 mm
Weight: 80g
Material: Silicone
ATTENTION: Read the user guide before purchase!
TRACK TEST #01 – RR50W
TEST RIDER: Lukas Backström
#01 TESTS CONDUCTED
Fork heater test 07/07/16
Air temperature -16 degrees
Track Surface Temperature – 21 degrees
Track – Karlskoga motorstation
Bike – 2015 Yamaha R1M
Fork heater tested -50w
Time fork was heated for -15 minutes
External temperature of fork leg above forsk seal -33 degree
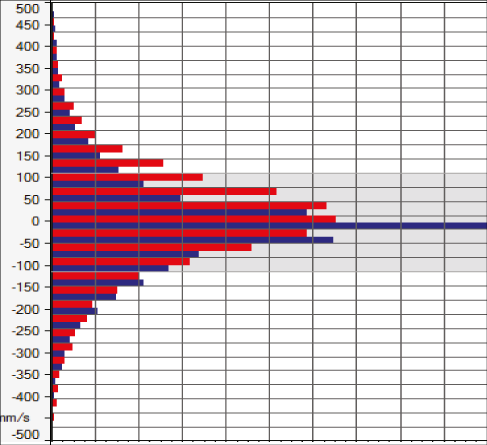
Blue – First rolling lap without fork heater (laptime 1.07.884)
Red – First rolling lap after fork had been heated with RR50W heater (laptime 1.07.250)
Figure 1 shows the amount of time the suspension spends traveling at certain speeds over 1 lap. This clearly shows that after the fork was heated the bike was much more free to move while compressing the suspension, while very little difference occurred to the suspension rebound. You can see that the bike spends a lot more time traveling in the 50mm/s – 200mm/s range.
#02 RESULTS - FIGURE 1
Figure 1 - Front fork travel derivative over time.
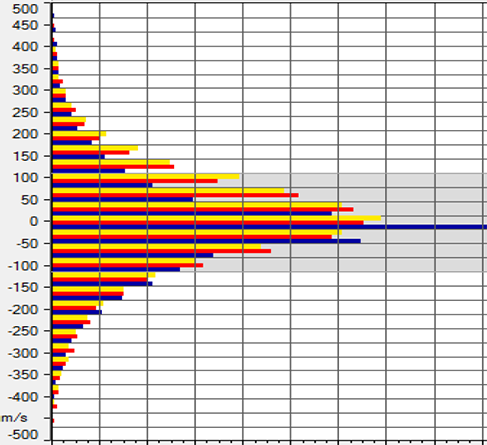
#03 RESULTS - FIGURE 2
Fork heater test 07/07/16
In figure 2 we introduce data from lap 9 of a test where the heater wasn’t used. You can clearly see how close the heated test is compared to the bike after it has had time to naturally heat the fork oil.
#04 RESULTS - FIGURE 2
Figure 2 - Front fork travel derivative over time.
_")